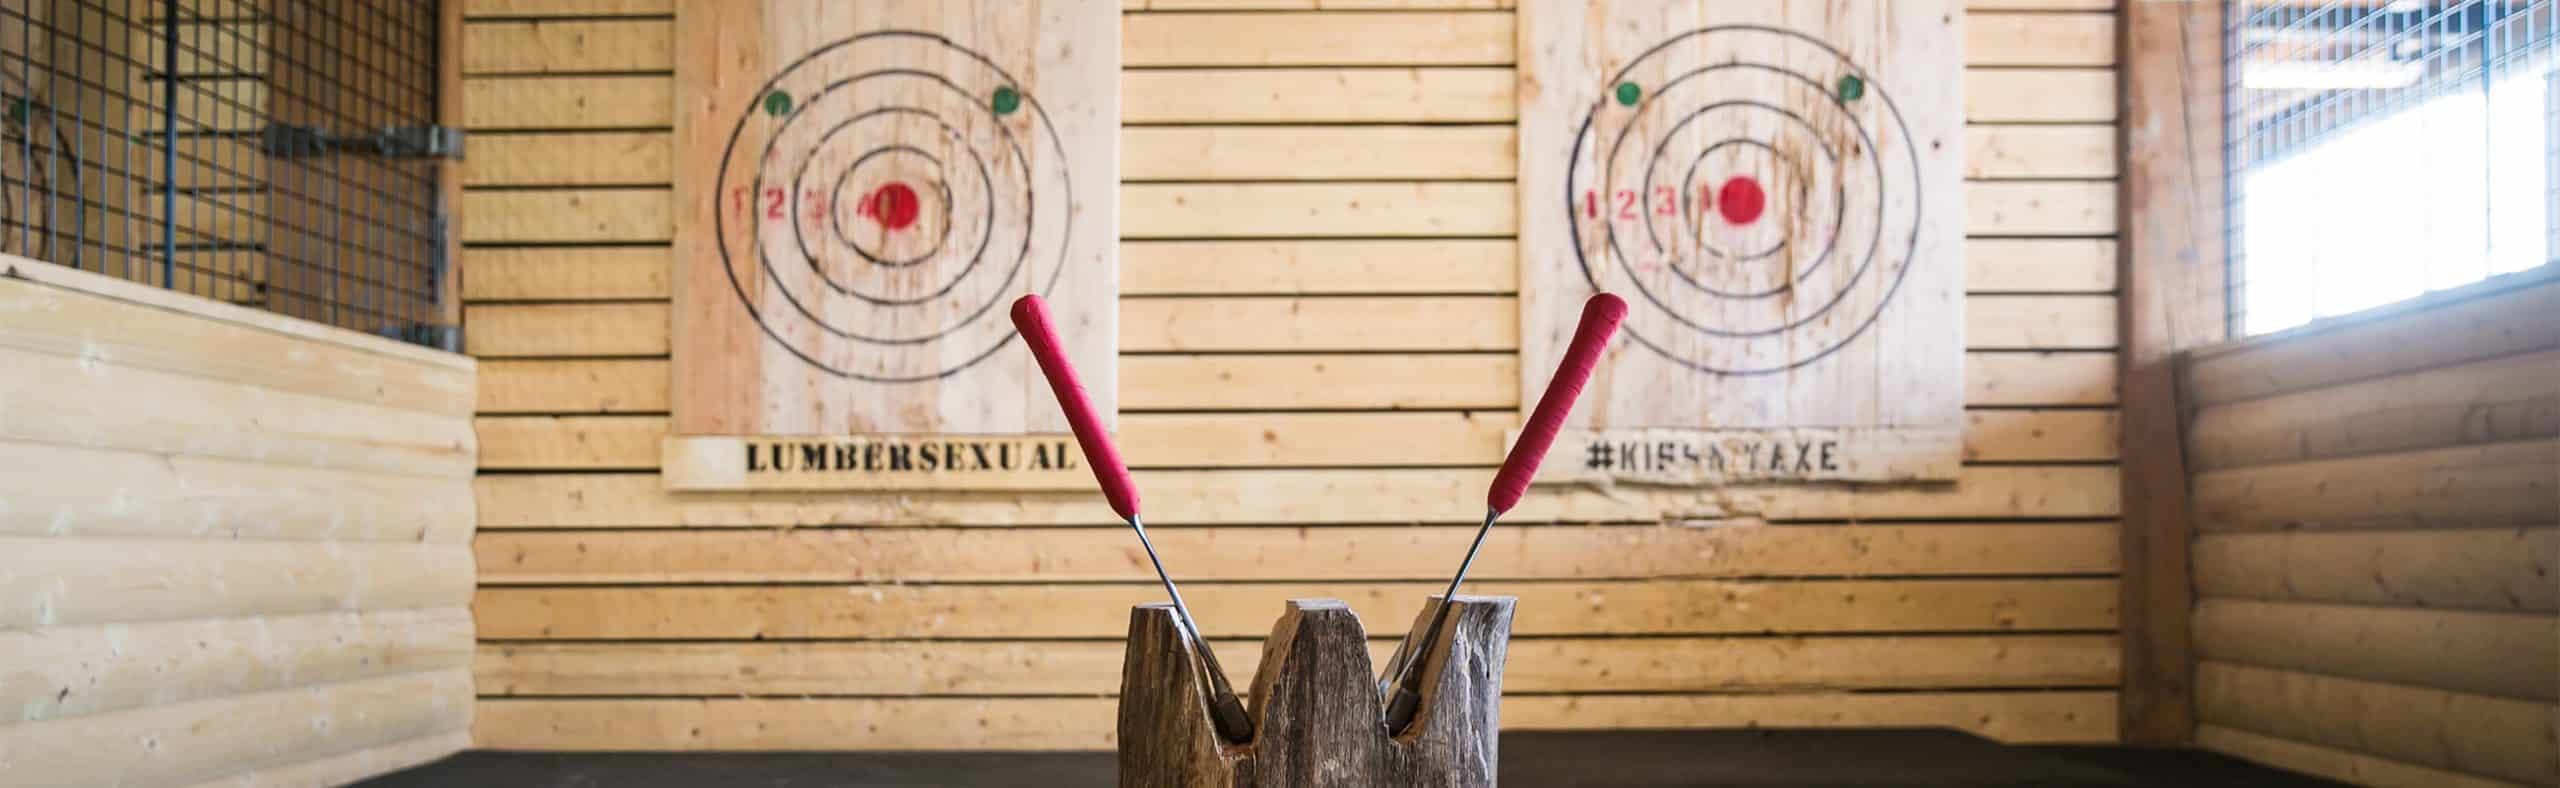
On the cusp of widespread vaccinations, Americans are weighing in on their interest and comfort level of returning to indoor entertainment venues. FlannelJax’s, North America’s premier axe-throwing and lumberjack sports experience, recently commissioned a survey of more than 1,000 U.S. adults to better understand their view on returning to indoor entertainment venues.
Conducted mid-February, the survey results demonstrate significant pent-up demand for in-person celebrations and group activities. More than 84% of survey respondents indicated that they miss them. Similarly, 86% of respondents are looking forward to participating in large group social events after the pandemic.
“These results affirm that, as the pandemic is controlled, there will be an immense demand for entertainment experiences with friends, family and co-workers. Americans are excited and anxious to return to safely having fun at indoor venues like ours,” said Stephen Schober, President and CEO of FlannelJax’s. “As many Americans are looking forward to returning to indoor entertainment venues, we are excited for what the future holds after the pandemic for concepts like FlannelJax’s.”
Below is the full results of the survey, commissioned by FlannelJax’s, to find Americans’ sentiment on the effects COVID-19 has had on the indoor entertainment industry. Also view the accompanying infographic here.
1. In the current state of the COVID-19 pandemic and associated restrictions, do you feel safe visiting indoor entertainment venues (i.e., bowling, axe-throwing, escape room, movie theatre, etc.)?
| |
|
|
Breakdown by Sex |
|
Breakdown by Age |
| Response |
Total |
|
Male |
Female |
|
18-29 |
30-44 |
45-60 |
60+ |
| Very Safe |
13.6% |
|
60.3% |
39.7% |
25.5% |
18.4% |
45.4% |
10.6% |
| Somewhat Safe |
29.4% |
|
50.8% |
49.2% |
29.2% |
22.3% |
33.4% |
15.1% |
| Somewhat Unsafe |
25.7% |
|
45.9% |
54.1% |
31.6% |
21.1% |
29.3% |
18.1% |
| Very Unsafe |
31.3% |
|
42.9% |
57.1% |
17.9% |
18.2% |
25.6% |
31.3% |
2. When do you anticipate feeling comfortable going to an indoor entertainment venue with friends, family and colleagues?
| |
|
|
Breakdown by Sex |
|
Breakdown by Age |
| Response |
Total |
|
Male |
Female |
|
18-29 |
30-44 |
45-60 |
60+ |
| Now |
20.3% |
|
50.0% |
50.0% |
24.8% |
20.5% |
43.8% |
11.0% |
| When case counts are minimal |
22.8% |
|
44.9% |
55.1% |
30.9% |
24.2% |
28.0% |
17% |
| After I receive the vaccine |
18.1% |
|
60.4% |
39.6% |
27.3% |
23.0% |
30.0% |
19.8% |
| When the majority of the population receives the vaccine |
38.9% |
|
60.4% |
56.1% |
22.6% |
16.4% |
28.0% |
33.0% |
3. How do you feel about not being able to attend entertainment venues with friends, family and colleagues?
| |
|
|
Breakdown by Sex |
|
Breakdown by Age |
| Response |
Total |
|
Male |
Female |
|
18-29 |
30-44 |
45-60 |
60+ |
| I really miss these experiences |
46.2% |
|
48.9% |
51.1% |
25.9% |
19.8% |
35.1% |
19.2% |
| I somewhat miss these experiences |
37.8% |
|
46.9% |
53.1% |
26.0% |
21.9% |
28.3% |
23.7% |
| I don’t miss these experiences |
12.4% |
|
49.2% |
50.8% |
22.7% |
18.8% |
28.9% |
29.7% |
| I am pleased to miss these experiences |
3.6% |
|
54.1% |
45.9% |
32.4% |
10.8% |
29.7% |
27.0% |
4. Please rank which reasons for visiting indoor entertainment venues you miss as a result of the pandemic.
| Response |
1 – Miss the most |
2 |
3 |
4 |
5 |
6 – Miss the least |
| Spending time with friends/family |
64.7% |
20.2% |
7.7% |
3.1% |
1.7% |
2.6% |
| Spending time with coworkers |
6.8% |
14.1% |
17.0% |
22.4% |
21.8% |
18.0% |
| Celebrating a personal event/milestone |
9.6% |
35.2% |
33.0% |
13.9% |
6.8% |
1.5% |
| Corporate Events/Celebrations |
2.4% |
5.0% |
11.3% |
28.0% |
37.4% |
15.9% |
| Date Night |
12.0% |
20.6% |
22.3% |
15.3% |
20.0% |
9.9% |
| Other |
4.6% |
4.9% |
8.7% |
17.4% |
12.4% |
52.0% |
Breakdown by Sex and Age:
Spending time with friends/family
| Response |
Male |
Female |
|
18-29 |
30-44 |
45-60 |
60+ |
| 1 – Miss the most |
62.9% |
66.4% |
61.1% |
60.8% |
66.4% |
70% |
| 2 |
21.8% |
18.7% |
19.1% |
23.9% |
18.7% |
20.2% |
| 3 |
7.4% |
8.0% |
7.1% |
9.1% |
8.6% |
6.0% |
| 4 |
2.8% |
3.4% |
3.4% |
3.8% |
4.0% |
0.9% |
| 5 |
2.6% |
0.9% |
|
4.1% |
1.0% |
0.6% |
1.3% |
| 6 – Miss the least |
2.6% |
2.6% |
|
5.2% |
1.4% |
1.8% |
1.7% |
Breakdown by Sex and Age:
Spending time with coworkers
| Response |
Male |
Female |
|
18-29 |
30-44 |
45-60 |
60+ |
| 1 – Miss the most |
8.4% |
5.2% |
11.2% |
4.8% |
6.1% |
4.3% |
| 2 |
18.6% |
9.9% |
12.7% |
14.8% |
14.7% |
14.2% |
| 3 |
16.6% |
17.4% |
16.9% |
12.9% |
14.7% |
24.5% |
| 4 |
21.6% |
23.2% |
19.9% |
22.5% |
30.0% |
22.0% |
| 5 |
18.8% |
24.7% |
|
19.5% |
21.5% |
22.0% |
24.5% |
| 6 – Miss the least |
16.2% |
19.6% |
|
19.9% |
23.4% |
12.8% |
18.0% |
Breakdown by Sex and Age:
Celebrating a personal event/milestone
| Response |
Male |
Female |
|
18-29 |
30-44 |
45-60 |
60+ |
| 1 – Miss the most |
8.0% |
11.0% |
6.7% |
10.0% |
10.4% |
11.2% |
| 2 |
29.5% |
40.6% |
33.7% |
31.1% |
35.2% |
40.8% |
| 3 |
36.5% |
29.7% |
35.2% |
37.8% |
33.0% |
26.2% |
| 4 |
16.8% |
11.2% |
15.4% |
14.8% |
14.1% |
11.2% |
| 5 |
7.0% |
6.5% |
|
7.1% |
4.8% |
6.1% |
9.0% |
| 6 – Miss the least |
2.2% |
0.9% |
|
1.9% |
1.4% |
1.2% |
1.7% |
Breakdown by Sex and Age:
Corporate Events/Celebrations
| Response |
Male |
Female |
|
18-29 |
30-44 |
45-60 |
60+ |
| 1 – Miss the most |
3.2% |
1.7% |
3.8% |
2.4% |
2.5% |
0.9% |
| 2 |
4.8% |
5.2% |
6.4% |
2.4% |
6.7% |
3.4% |
| 3 |
11.2% |
11.4% |
12.4% |
9.6% |
13.8% |
8.2% |
| 4 |
28.9% |
27.1% |
29.2% |
25.4% |
25.1% |
33.1% |
| 5 |
36.7% |
37.9% |
|
34.1% |
45.0% |
37.6% |
33.9% |
| 6 – Miss the least |
15.2% |
16.6% |
|
14.2% |
15.3% |
14.4% |
20.6% |
Breakdown by Sex and Age:
Date Night
| Response |
Male |
Female |
|
18-29 |
30-44 |
45-60 |
60+ |
| 1 – Miss the most |
13.2% |
10.8% |
13.1% |
18.2% |
10.4% |
7.3% |
| 2 |
20.8% |
20.4% |
22.9% |
25.4% |
19.9% |
14.6% |
| 3 |
20.0% |
24.5% |
21.4% |
23.4% |
22.0% |
22.8% |
| 4 |
14.0% |
16.5% |
12.0% |
11.5% |
16.8% |
20.2% |
| 5 |
23.2% |
17.0% |
|
22.1% |
16.8% |
20.8% |
19.3% |
| 6 – Miss the least |
9.0% |
10.8% |
|
8.6% |
4.8% |
10.1% |
15.9% |
Breakdown by Sex and Age:
Other
| Response |
Male |
Female |
|
18-29 |
30-44 |
45-60 |
60+ |
| 1 – Miss the most |
4.4% |
4.9% |
4.1% |
3.8% |
4.3% |
6.4% |
| 2 |
4.6% |
5.2% |
5.2% |
2.4% |
4.5% |
6.9% |
| 3 |
8.4% |
9.0% |
7.1% |
7.2% |
8.3% |
12.5% |
| 4 |
16.0% |
18.7% |
20.2% |
22.0% |
10.1% |
20.2% |
| 5 |
11.8% |
12.9% |
|
13.1% |
11.0% |
12.8% |
12.0% |
| 6 – Miss the least |
54.9% |
49.4% |
|
50.2% |
53.6% |
59.6% |
42.1% |
5. I am looking forward to participating in social group events and celebrations after the pandemic.
| |
|
|
Breakdown by Sex |
|
Breakdown by Age |
| Response |
Total |
|
Male |
Female |
|
18-29 |
30-44 |
45-60 |
60+ |
| Strongly agree |
41.8% |
|
45.0% |
55.0% |
23.8% |
21.5% |
35.3% |
19.4% |
| Agree |
44.5% |
|
50.5% |
49.5% |
25.6% |
20.4% |
29.9% |
24.1% |
| Disagree |
10.4% |
|
50.9% |
49.1% |
35.2% |
14.8% |
26.9% |
23.2% |
| Strongly disagree |
3.3% |
|
52.9% |
47.1% |
23.5% |
17.7% |
20.6% |
38.2% |
6. Has your engagement and relationships with co-workers been strained because you have not been able to socialize together beyond virtual meetings?
| |
|
|
Breakdown by Sex |
|
Breakdown by Age |
| Response |
Total |
|
Male |
Female |
|
18-29 |
30-44 |
45-60 |
60+ |
| Major Improvement |
6.5% |
|
58.2% |
41.8% |
43.3% |
16.4% |
29.9% |
10.5% |
| Improvement |
7.6% |
|
49.4% |
50.6% |
26.6% |
16.5% |
46.8% |
10.1% |
| Little or No Change |
42.5% |
|
48.6% |
51.4% |
22.7% |
17.3% |
32.7% |
27.3% |
| Some Reduction |
25.5% |
|
46.6% |
53.5% |
28.4% |
26.2% |
29.1% |
16.4% |
| Major Reduction |
16.9% |
|
46.3% |
53.7% |
22.3% |
21.1% |
26.3% |
30.3% |
7. In your work, the challenges of developing and maintaining relationships virtually with co-workers and clients has negatively impacted the quality of your work.
| |
|
|
Breakdown by Sex |
|
Breakdown by Age |
| Response |
Total |
|
Male |
Female |
|
18-29 |
30-44 |
45-60 |
60+ |
| Strongly agree |
10.4% |
|
60.2% |
39.8% |
26.9% |
22.2% |
34.3% |
16.7% |
| Agree |
33.0% |
|
51.2% |
48.8% |
31.3% |
24.0% |
30.2% |
14.6% |
| Disagree |
37.8% |
|
46.9% |
53.1% |
24.2% |
19.1% |
28.3% |
28.3% |
| Strongly Disagree |
18.7% |
|
39.7% |
60.3% |
18.6% |
14.4% |
39.2% |
27.9% |
8. I am looking forward to participating in corporate team-building events and celebrations after the pandemic.
| |
|
|
Breakdown by Sex |
|
Breakdown by Age |
| Response |
Total |
|
Male |
Female |
|
18-29 |
30-44 |
45-60 |
60+ |
| Strongly Agree |
18.5% |
|
53.7% |
46.4% |
31.3% |
22.3% |
33.3% |
12.5% |
| Agree |
43.1% |
|
47.1% |
52.9% |
27.1% |
20.6% |
33.6% |
18.6% |
| Disagree |
23.8% |
|
45.9% |
54.1% |
23.2% |
20.3% |
26.0% |
30.5% |
| Strongly Disagree |
14.7% |
|
49.3% |
50.7% |
19.1% |
15.1% |
32.2% |
33.6% |